
How-To: Reading Candlestick Patterns for Beginners
How-To: Reading Candlestick Patterns for Beginners. Get practical lessons and hands-on examples at AIComputerClasses in Indore to master Trading & Stock Market skills quickly. This article from AIComputerClasses Indore breaks down how to read candlestick patterns into actionable steps. Ideal for beginners and working professionals seeking fast skill gains. Follow practical exercises and tool-based examples to learn rapidly. Includes references to tools like ChatGPT, Power BI, Excel, Figma, or Python where appropriate.
How-To: Reading Candlestick Patterns for BeginnersLearning to read candlestick charts is one of the most essential skills for anyone entering the stock market or crypto trading. These patterns help traders interpret market sentiment and make informed buy or sell decisions.
At AIComputerClasses Indore, we teach practical methods for identifying and interpreting candlestick patterns using tools like TradingView, Excel, and Python. Whether you’re a complete beginner or a working professional, this guide will help you understand how candlesticks tell the story of price action.
Candlestick patterns are visual representations of price movement within a specific time frame. Each candlestick consists of four key data points:
- Open price
- Close price
- High price
- Low price
When combined over time, these candles form recognizable patterns that indicate whether the market is bullish (uptrend) or bearish (downtrend).
Every candlestick has three main parts:
- Body – The difference between opening and closing prices.
- Wicks (or Shadows) – The high and low points of the trading period.
- Color – Typically, a green (or white) candle means price closed higher than it opened (bullish), while red (or black) means price closed lower (bearish).
Example:
   |      ← Upper wick (high)
 ████     ← Candle body (open to close)
   |      ← Lower wick (low)
💡 Learn from Experts at AI Computer Classes – Indore!
Boost your trading and financial analysis skills with hands-on practice in real market simulations.
👉 Join our latest Trading & Stock Market batch today at AI Computer Classes
📍 Located in Old Palasia, Indore
🔍 Types of Candlestick PatternsCandlestick patterns can be grouped into single, double, and triple formations. Each pattern provides insights into potential market direction.
1. Single Candlestick Patternsa. Doji- Indicates market indecision.
- The opening and closing prices are nearly the same.
- Commonly signals a potential reversal.
- Appears after a downtrend.
- Small body with a long lower wick.
- Suggests bullish reversal — buyers are gaining control.
- Appears after an uptrend.
- Small body with a long upper wick.
- Suggests bearish reversal — sellers are pushing prices down.
- A large green candle completely engulfs the previous red candle.
- Indicates strong buying pressure and a likely trend reversal upward.
- A large red candle engulfs the previous green candle.
- Suggests increasing selling pressure and potential downtrend.
- Two candles with identical highs (tops) or lows (bottoms).
- Signals possible market reversal zones.
- Consists of three candles: a red candle, a small neutral (Doji), and a large green candle.
- Indicates a bullish reversal.
- Opposite of the Morning Star — red candle after a neutral or Doji.
- Indicates a bearish reversal.
- Three consecutive green candles, each closing higher.
- A strong signal of continued uptrend.
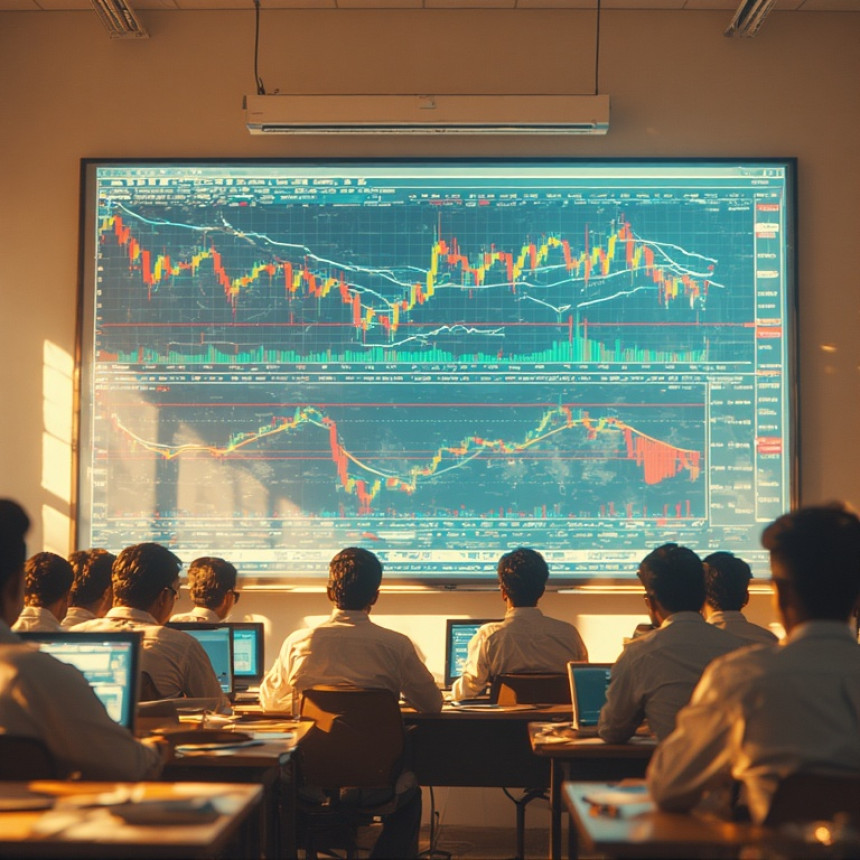
TradingView provides free, interactive candlestick charts.
Steps to Analyze:- Open any stock or crypto chart.
- Select Candlestick View under chart styles.
- Add indicators like RSI or Moving Averages for better context.
- Zoom in to identify hammer, doji, or engulfing patterns.
You can even use Python scripts to automatically detect these patterns — a useful skill taught at AIComputerClasses Indore.
💡 Hands-On Learning at AI Computer Classes – Indore!
Master tools like TradingView, Excel, and Python to analyze stock trends efficiently.
🚀 Start your practical training today at AI Computer Classes
📍 Old Palasia, Indore
📘 Common Mistakes Beginners Make- ❌ Ignoring trend context — patterns work best within overall market direction.
- ❌ Using small time frames — causes false signals.
- ❌ Overtrading — not every pattern means action.
- ❌ Forgetting confirmation — always use volume or indicators to confirm a pattern’s strength.
👉 Pro Tip: Combine candlestick patterns with support and resistance levels or technical indicators like RSI, MACD, or Moving Averages.
Candle TypeDescriptionLikely OutcomeHammerLong lower shadow, small bodyBullish ReversalShooting StarLong upper shadowBearish ReversalDojiOpen ≈ CloseIndecisionEngulfingLarge body overtakes previousTrend Reversal
Try recreating these patterns in Excel or Power BI charts for better visualization — a creative exercise we use at AIComputerClasses Indore.
At AIComputerClasses Indore, our Trading & Stock Market program includes:
✅ Candlestick Analysis & Chart Patterns
✅ Technical Indicators (RSI, MACD, Bollinger Bands)
✅ Trading Psychology & Risk Management
✅ Practical TradingView Workshops
📈 Whether you're preparing for a trading career or enhancing your financial knowledge, our hands-on approach ensures you understand both concept and execution.
Candlestick patterns are the language of traders — they tell you what’s happening behind every price move. By understanding these signals, you can predict market behavior and make smarter decisions.
Start practicing today with real-world examples and join AIComputerClasses Indore to become confident in technical analysis.
📞 Contact AIComputerClasses – Indore
✉ Email: hello@aicomputerclasses.com
📱 Phone: +91 91113 33255
📍 Address: 208, Captain CS Naidu Building, near Greater Kailash Road, Opp. School of Excellence For Eye, Old Palasia, Indore, Madhya Pradesh 452018
🌐 Website: www.aicomputerclasses.com